

The revenge of team transitory?
Inflation pain may be easing, but that's not all good news

There’s a decent model of the recent spike in inflation that goes something like this:
The COVID-19 pandemic shuts down much of the economy, and a lot of factories slash their production expectations in response
To stave off a major economic depression the Fed engages in massively expansionary monetary policy (and accommodates an unprecedentedly large fiscal stimulus) and the economy quickly turns around
The quick economic turnaround caught a lot of suppliers (like chip makers) by surprise, and it is hugely expensive and time-consuming to quickly ramp up production.
People newly flush with cash from the expansionary policy chase fewer goods, sending prices soaring
Russia then invades Ukraine, and energy and food supplies are hammered. Prices soar even further.
A combination of easing supply constraints and a newly hawkish Fed crushing demand combine to ease inflation by fall 2022, and price growth returns to normal by early 2023
I think this model is broadly true and the first five steps I’ve written about extensively before. The controversial part is step six. There is an opposing camp of inflation maximalists who believe the large fiscal stimulus, lost Fed credibility and self-fulfilling expectations send the economy into an extreme inflationary spiral. I think the data coming out the last few days suggests that view–which was always vaguely implausible–is even less likely to be true.
Market expectations remain anchored
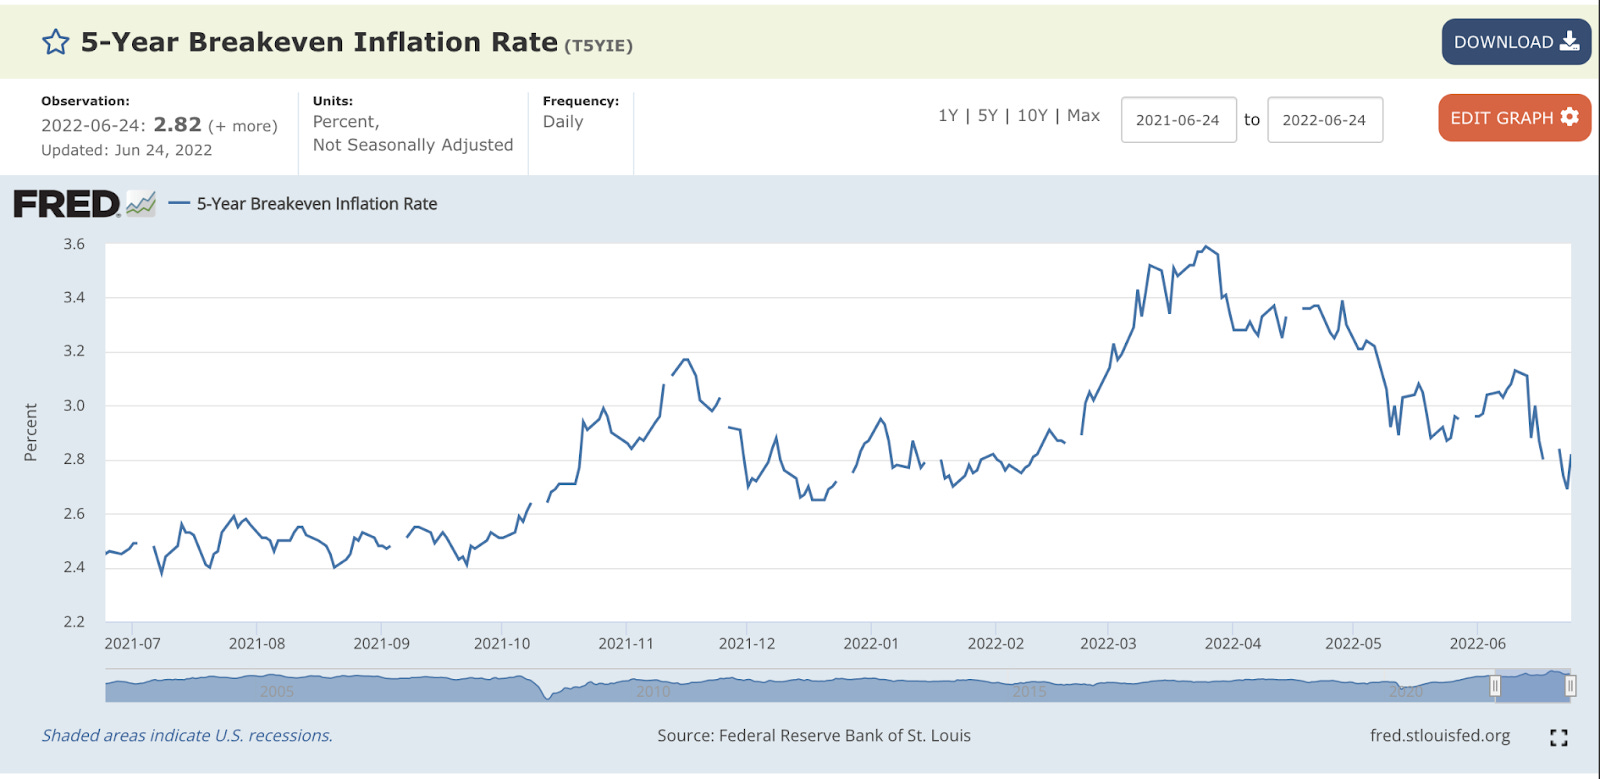
At the risk of sounding like a broken record, but market expectations are far more likely to be accurate at forecasting than pundits (or worse, crypto/gold hucksters). The five-year breakeven inflation rate–which measures the spread between inflation-protected treasuries and unprotected treasuries–sits at a healthy 2.82%, down from 3.59% in March and 3.13% in May. The market forecasts for years 6-10 sit at 2.30%.
Why do we trust this measure? Well, suppose that markets, teeming with all the fancy quants and suits on Wall Street, truly expected inflation to be 4% over the next five years. Then there’s free money to be made in buying protected bonds, as they’re clearly underpriced. Unless you have strong reason to believe that random pundit is more accurate than the aggregated wisdom of Wall Street, then we should probably think this measure is roughly accurate.
Meanwhile, fed fund futures markets have largely stabilized. If inflation remained at a highly elevated level through 2023, we should expect the Fed to continue hiking rates. But both Kalshi forecasts and CME Fed Fund futures suggest that rate hikes will conclude by the end of the year. All of this is consistent with inflation falling.
Home prices should starting declines
Housing is one of the biggest inputs to the Bureau of Labor Statistics’ inflation measurements and rightfully so, considering its centrality to household budgets. Naturally, the massive run-up in home and rental prices has contributed to the record high inflation, as rental prices have risen almost 4% year-to-date.

But respite appears to be on the horizon. Housing prices, like all markets, are a function of supply and demand. Both factors appear to be majorly changing. Large amounts of supply appears to either be coming onto the market, or soon will be, as evidenced by the rise in housing construction.

Meanwhile, the surge in mortgage rates will surely substantially reduce demand for home purchases.

We have other indications as well. The percent of properties with recent price reductions has risen to 24%, which is still below the levels of 2018 and 2019, but is rising fast. Meanwhile, the one-time shock in the preference from work-from-home (which one study estimates is responsible for about 15% of the increase in the price of homes) should already be factored into prices and as lumber prices have tumbled 40% since May, supply-side constraints should also be easing.
However, a weird statistical quirk will prevent these factors from percolating into the CPI data soon. The shelter component consumer price index is supposed to reflect the amount that people actually pay for housing. So suppose rental prices doubled (increased 100%) overnight. If everyone lives in one-year rental leases, then even though prices doubled, CPI would only reflect an 8.3% (100/12) month-over-month increase in rental prices. There are some additional wrinkles introduced as the BLS has to also calculate the rent that the owner of a house charges to themselves (owner-occupied imputed rent), but this simplification captures the basic idea that the shelter component of CPI can be heavily lagged.
That lag highlights the difficulty of policymaking using real-time economic data. At some level, the Fed feels the political heat from persistently high inflation prints, and it feels a bit unsatisfactory to say “well it’s slightly less bad than it seems because of a statistical quirk in the way the BLS calculates imputed rent”. And what do you do when two different real-time measures completely disagree? Core PCE seems to think inflation is stable at 0.3%, while core CPI thinks it’s still sky-high. The University of Michigan survey seems to suggest inflation expectations remain high, but the aforementioned market data suggests they remain well-anchored. Q1 GDP and Q1 GDI (which purport to measure the same thing using different techniques) tell near diametrically opposite stories. It’s not a viable strategy to just throw up your hands and say “who knows”, but honestly, the wealth of different metrics suggesting wildly different courses of actions should humble would-be predictors. I think the data suggests housing price growth should slow dramatically by the end of the year (if not fall altogether), but there’s a very good chance I could be wrong.
Commodity prices tumbling
Another major story of early 2022 was the massive spike in commodity prices. Those increases have largely, though not entirely, been reversed in recent weeks. Copper is down 25% from peak, tin is down 43% and steel is down 15%, back to its December 2021 levels. Even cotton, which spiked in May, is down 25% from that local peak. Wheat future prices–which were especially impacted by the Russian invasion of Ukraine–have also fallen by about a quarter since May. Gas futures also suggest a roughly 25% fall over the next few months.

Source: Trading Economics
These prices won’t immediately manifest in cheaper prices at the grocery store. There can be a meaningful lag between commodity prices and consumer prices, but since inflation is a measure of a rate of change, stagnant or falling commodity prices will put substantial downward pressure on inflation overall.
However, this is not unmitigated good news. If the price decreases were simply a story of “we shuttered plants during COVID-19 and it took a year to get supply fully back up and running”, then this price decrease would be fantastic. But the anecdotal evidence suggests that these future prices are downstream of market pessimism about global growth prospects. Metals in particular have fallen victim to bearishness about Chinese and European manufacturing. Metals are also an especially interest-rate sensitive commodity for two reasons: first, factories are a quintessential example of “spending large amounts today in exchange for future in the future” so when the discount rate rises, the relative costs today rise relative to the future benefits. Second, metals are easily stored (compared to, e.g. oil or food) mean that metal production is more oriented towards expectations of future demand as opposed to current usage, and therefore more exposed to interest rates than oil.
The above cases further illustrate the two ways in which inflation can be brought under control: supply and demand. If prices are falling because more supply is being brought to market, then that’s great and a reason to celebrate. But if prices are falling because people can’t afford to buy things at the old prices, well that’s not great at all. As economist Scott Sumner would say, never reason from a price change. Kalshi markets suggest there’s a 79% chance of a second negative GDP print this year and the probability of unemployment topping 6% this year has doubled from late May to 25%, so I worry a decent chunk of the autumn 2022 inflation slowdown will be from slowing growth and lowered living standards.
Supply factors are the “win-win” way to reduce inflation. Liberalizing land use regulations could dramatically lower the price of housing. Creative use of the strategic petroleum reserve could encourage greater supply in the oil markets. Streamlining permitting for new investments could make everything from energy to shelter to consumer goods substantially cheaper. Sadly, supply-side reforms take time to work. For instance, if we eliminated all zoning rules today, it would still be months to years before the new housing entered the market and while prices are somewhat forward-looking, it wouldn’t exactly solve the immediate-term political problems for the President. We should do these reforms nevertheless, but outside of a few pieces of low-hanging fruit (tariff reduction, Jones Act repeal, etc.), painful demand reduction is the “fastest” way to lower prices. Kalshi’s markets may expect month-over-month inflation to fall to 0.3-0.4% by November, but the path there might be painful.
So… was Team Transitory right?
If prices fall as expected, does this mean “Team Transitory”--that mass of center-left economists who attributed inflation to temporary factors that would go away without issue with patience–ultimately correct? No. Even though the maximalists like Jack Dorsey were even more wrong, Team Transitory was still incorrect. While supply shocks are a major cause of the inflation, Congress and the Fed ultimately did drive NGDP substantially above trend and getting inflation back down has required some painful hiking. Without a liquid NGDP futures market, it’s hard to say with confidence whether this has changed, but my reading of the evidence suggests that the newly hawkish stance of monetary policy has restored NGDP expectations back to a sustainable level.
As a final note, I’d add that there’s no relationship between the size of an economic expansion and the subsequent contraction. Growth will likely slow–that is the unfortunate price of getting NGDP expectations under control–but this is not 2008.